matplotlib中文亂碼解決, 散佈圖
matplotlib中文亂碼解決
方法一:matplotlib.rc('font', **{'sans-serif' : 'SimHei',
'family' : 'sans-serif'})
方法二:python
plt.xlabel('戶數',fontproperties='SimHei')
黑體(SimHei)
微軟正黑體(Microsoft JhengHei)
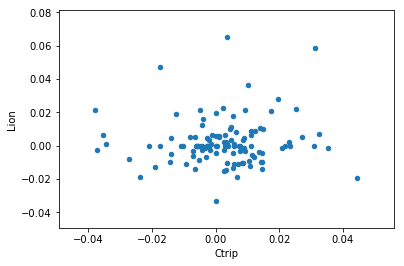
散佈圖(Scatter Diagram, Scatter Plot)
rets.plot(kind='scatter', x='Ctrip', y='Lion' )import matplotlib.pyplot as pltplt.scatter(X[:,0],X[:,1],color="black")
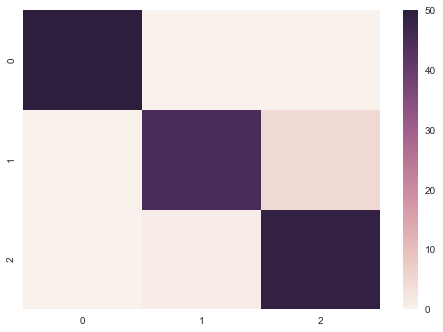
import seabornseaborn.heatmap(confusion_matrix(iris.target, predicted))
Seaborn提供了許多進階的視覺化如:熱度圖(Heatmap)、集群圖(Clustermap)、小提琴圖(Violinplot)等等。Plotly則提供了更多視覺化方便的即時調整功能,如:挑選變數、放大、縮小、下載等。Boken提供探索式分析(Exploratory Data Analysis),可以調整變數值的範圍,即時產生作圖。
其它圖形可參考 如何在論文中畫出漂亮的插圖?